Management Information (MI) is often seen as dry and technical, filled with unhelpful numbers and jargon; and far too long!
But it does not have to be this way. It is not that difficult to prepare MI that can be a powerful tool to enhance strategic decision-making, to help you stay in control of your business and to sleep easy at night.
But first, what is MI?
In its simplest and broadest form it is all the information relating to the activities of a business. The secret is distilling it down into something meaningful and concise – and that is where we come in.
The key is to present the MI in a way that is engaging, insightful and actionable. What we at Tectona call “Actionable Insights”.
Here are some ideas to breathe life into your MI:
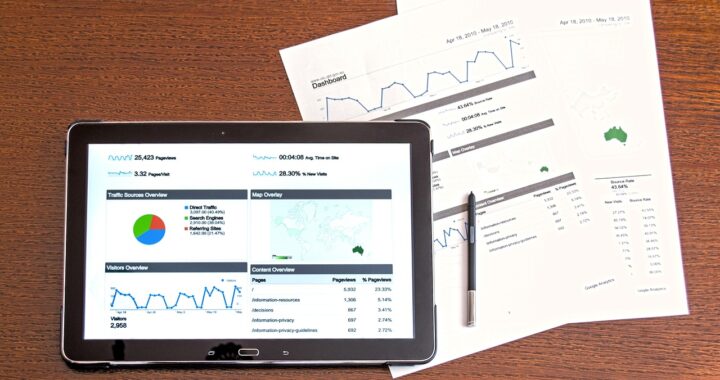
1. Visualize Your Data
- Charts and Graphs and Traffic Lights: Transform raw data into easy-to-understand visuals. Use bar charts, line graphs and colour (traffic lights) to highlight trends, comparisons and the key areas to focus on.
- Dashboards: Create interactive dashboards that allow users to drill down into specific areas of interest.
- Waterfall Charts: which highlight the key differences between 2 reported figures –for example, the retained profit last month and the retained profit this month.
2. Tell a Story with Your Data
- Narrative Analysis: Weave a compelling narrative around your data. Explain the “why” behind the numbers.
- Highlight Key Trends: Focus on the most important trends and insights – those traffic lights again.
- Use Storytelling Techniques: Engage your audience with a clear beginning, middle, and end focusing on what is being, or will be, done to remedy any areas of concern.
3. Focus on Key Performance Indicators (KPIs)
- Identify Key Metrics: Determine the KPIs that are most relevant to your business objectives and make sure you report specific performance against these – again use colour or traffic lights to draw the eye to important variances.
Tectona Tip: Remember you can have Lead Indicators (like foot fall, number of enquiries, the conversion rate or number of complaints) as well as the Lag Indicators we are probably more used to (like the number of sales made, revenue generated per user, the number of items returned, the profit by product or overall profit (or loss) for the period).
- Track Progress: Monitor KPIs over time.
- Set SMART Goals: Establish goals to remedy underperformance.
4. Consider making Your MI Interactive
- Interactive Reports: Use tools that allow users to filter, sort, and customise reports.
- Mobile Access: Enable users to view and analyse reports on their mobile devices.
5. Collaborate with Your Audience
- Understand Their Needs: Work closely with your audience to identify their specific information requirements, especially those not confident discussing finance.
- Tailor Your Reports: Customize reports to meet the needs of different stakeholders.
- Provide Training and Support: Offer training sessions to help users understand and interpret the information.
By following these guides, you can transform your management accounts from “dry and dull” with little real value into an invaluable tool that recipients look forward to receiving and that will encourage rapid and informed decision making based on facts.
Now is the time of year you should be getting on top of this stuff; and if you need us to help show you the way, please contact Tectona.
About Tectona
Tectona Partnership helps business owners sleep at night by embedding one of our 17 commercially minded FD/CFOs in your management team.
Very often, a part time (or fractional) FD/CFO is the most effective solution.
We make sure you have the necessary management information and strategic insight to make informed decisions and reduce risk; and we will absolutely tell you what you need to know, when you need to know it.
“TECTONA PART TIME FDS SUCCEED WHERE OTHERS … DON’T.”
Have a read of one of our case studies here